Master SQL. Ace Interviews. Build Databases.
Your go-to resource for SQL, PL/SQL & PostgreSQL tutorials, tips, and interview prep.
Latest Posts :


Trending :
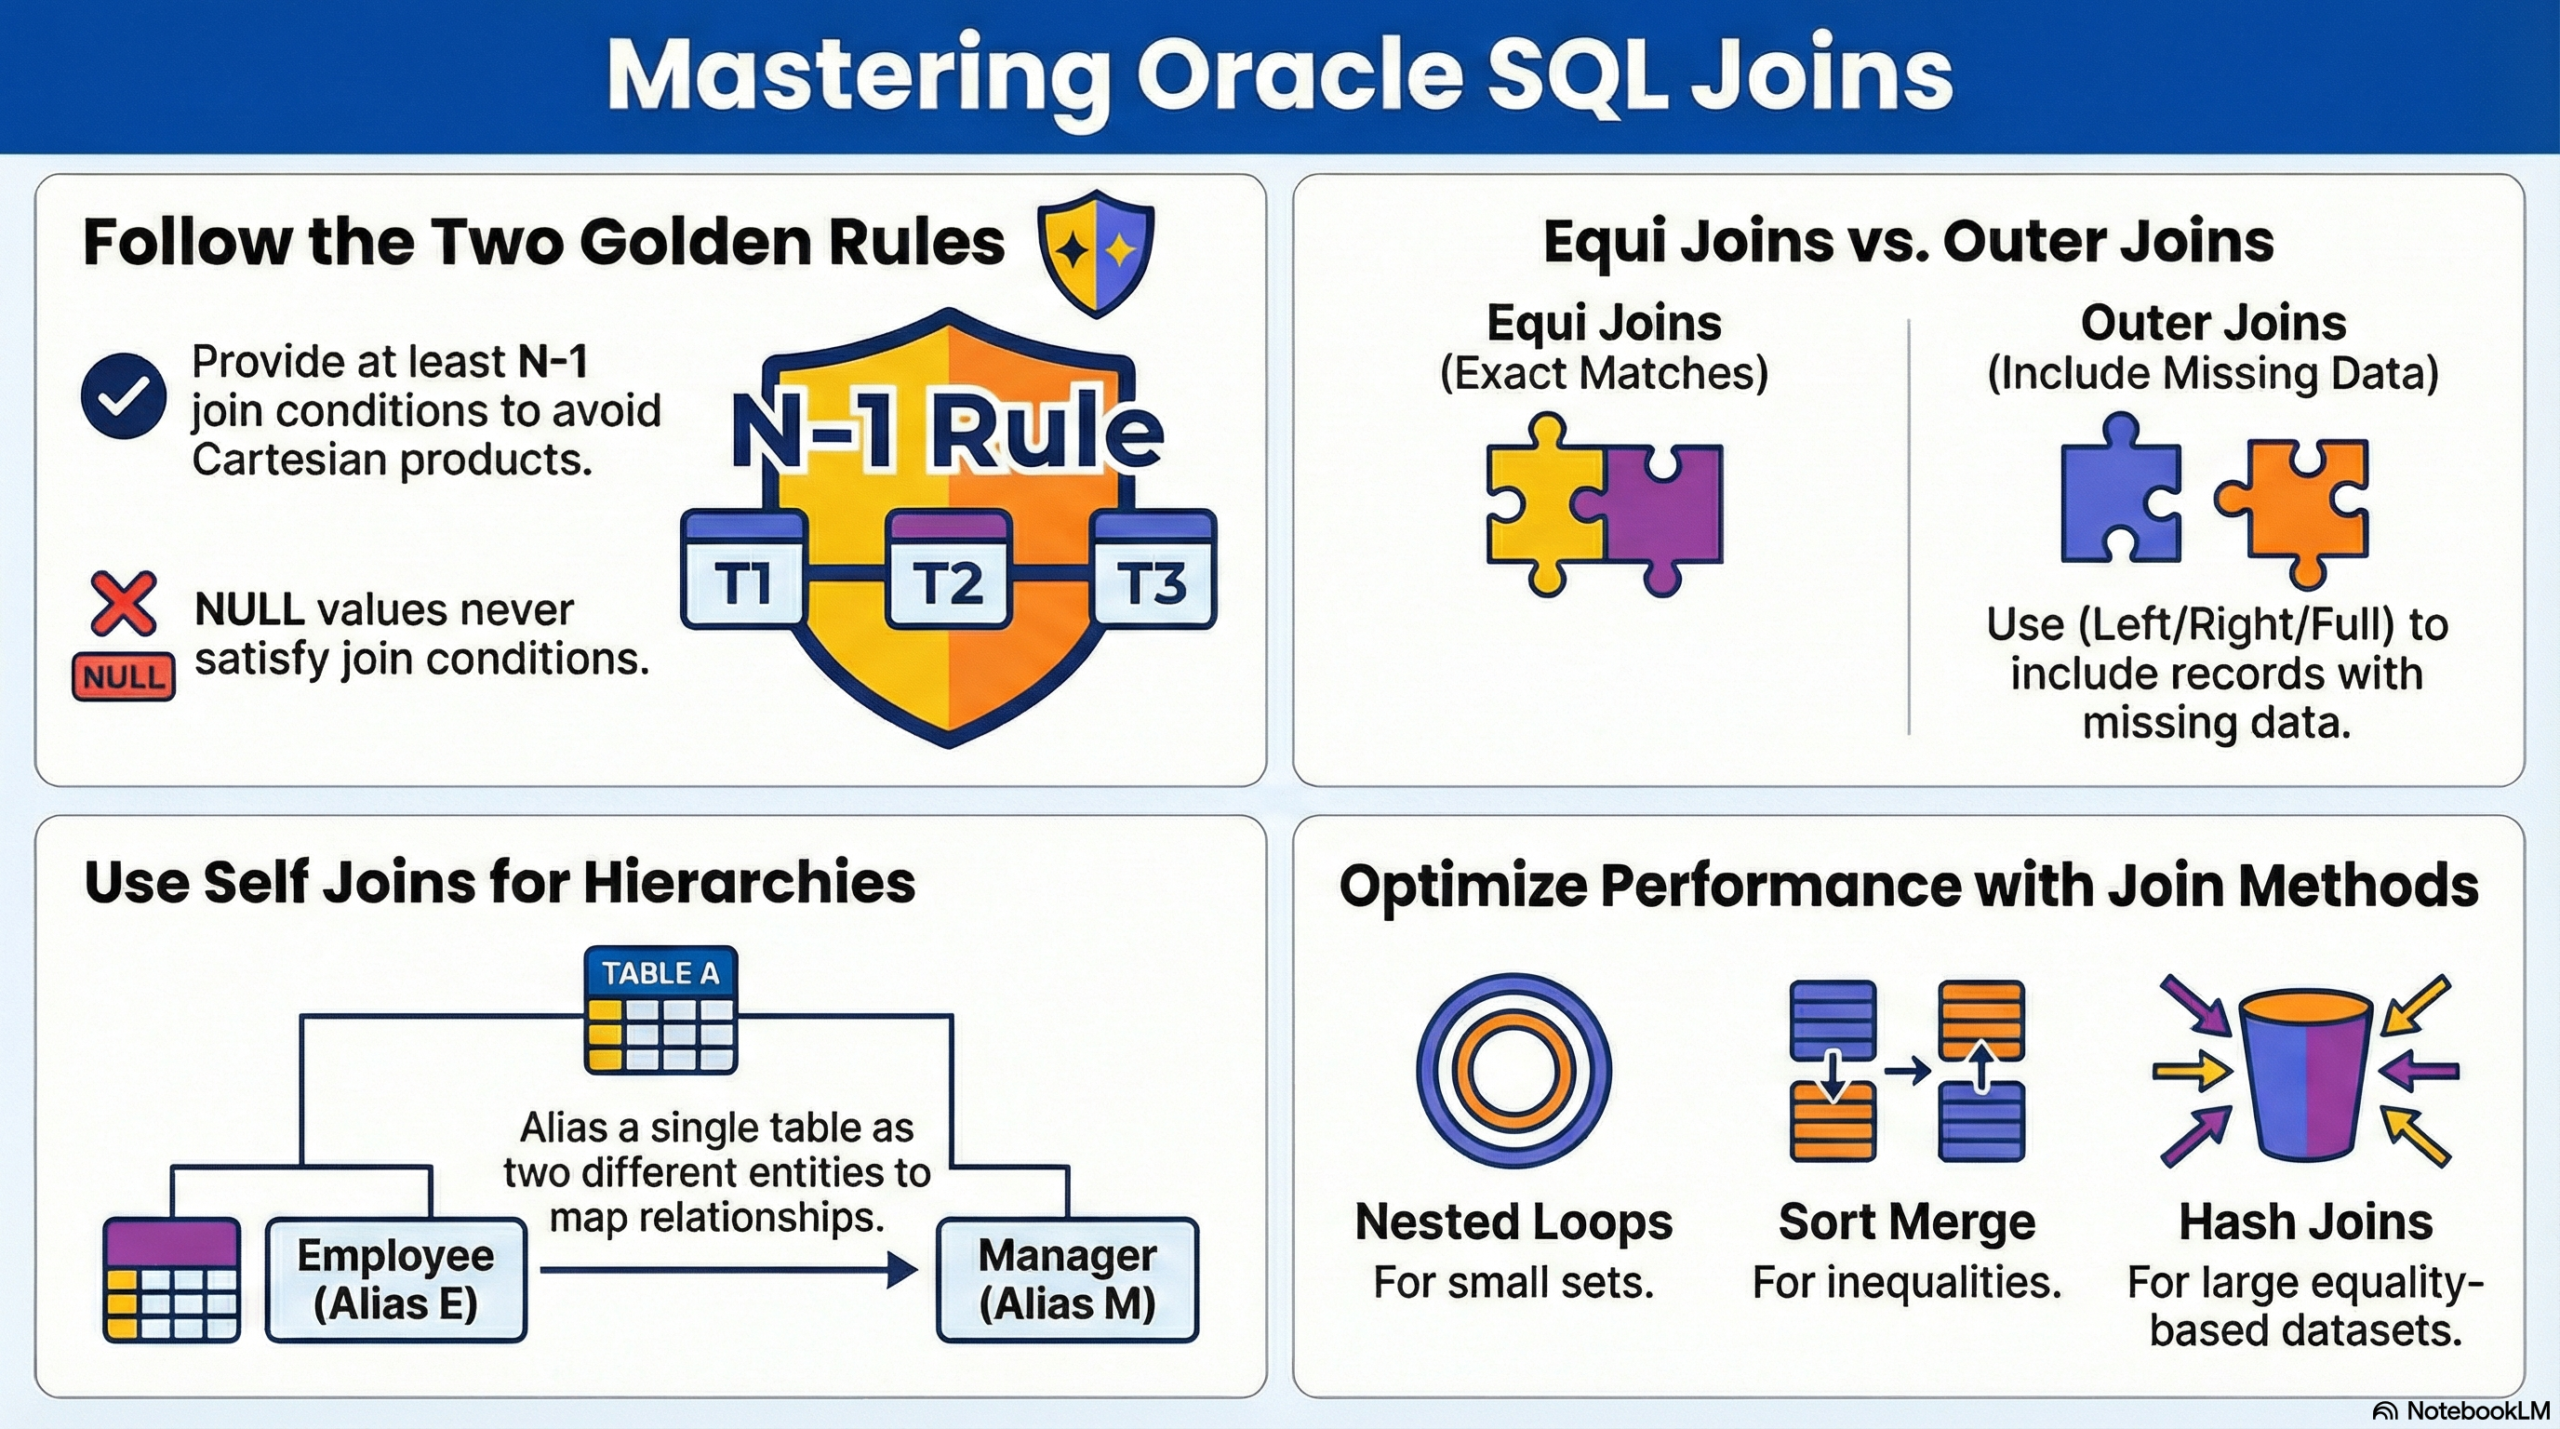
Mastering Oracle SQL Joins: The Ultimate Guide to Data Retrieval and Performance
In the world of relational database management systems (RDBMS), data is rarely stored in a single, massive table. Instead, it…
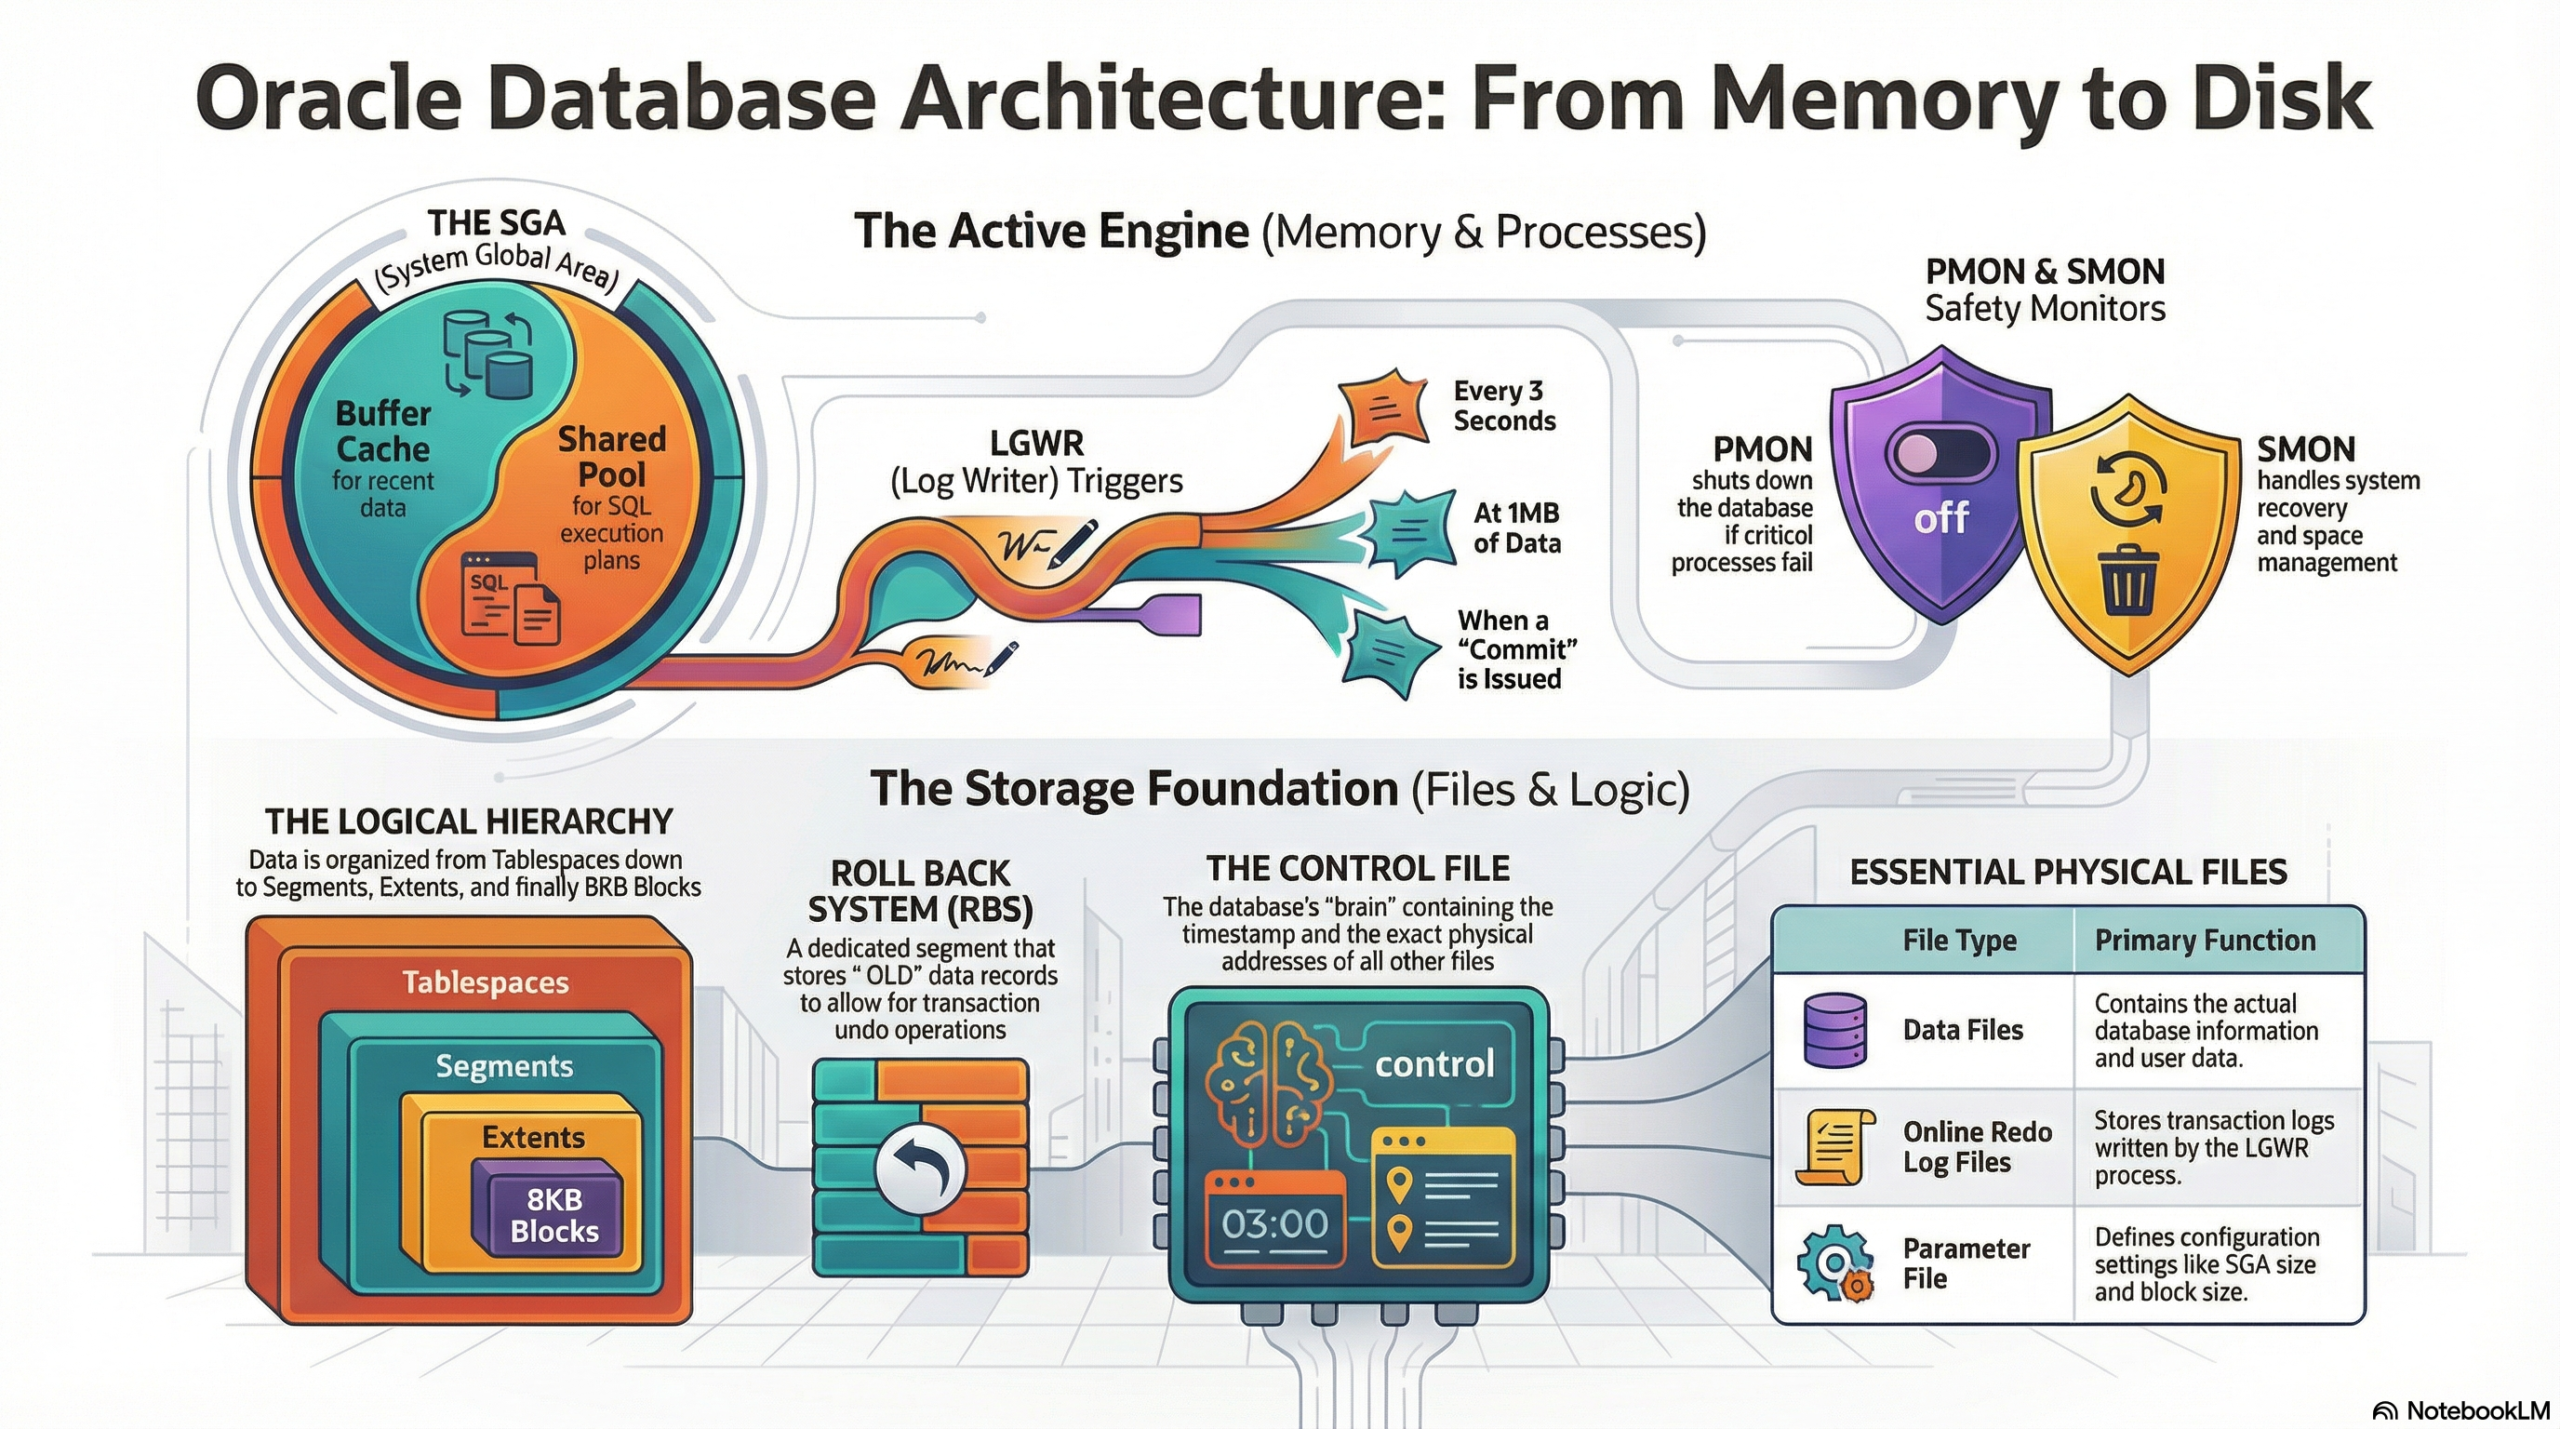
Mastering Oracle Database Architecture: A Comprehensive Overview
Ever wondered what happens behind the scenes when you hit “Execute” on a SQL query? It’s not just magic; it’s…
Mastering PostgreSQL Architecture: 6 Powerful Steps to Optimize Performance & Scalability
PostgreSQL, often referred to as Postgres, is a powerful open-source relational database management system (RDBMS) known for its robustness, extensibility,…
Understanding Oracle Triggers – A Comprehensive Guide with Examples
In the world of database management, ensuring data consistency, integrity, and automation is crucial. Oracle triggers are a powerful tool…
SQL Query Design Patterns: Writing Efficient Queries
In the world of databases, writing efficient and maintainable SQL queries can often feel like solving a complex puzzle….
Master Oracle Interview Questions: Key Concepts & Examples for 2024
Preparing for an Oracle database interview can be challenging, especially with the range of advanced concepts you need to cover….