

Introduction:
Have you ever wondered how to turn rows into columns in SQL? That’s where the PIVOT function comes in! It’s a handy tool that can help you reorganize data, especially when you’re working on reports that need a cleaner, more readable format. In this blog, I’ll walk you through how to use PIVOT in SQL with some easy-to-understand examples.
What is PIVOT in SQL?
The PIVOT function is used to flip data around, turning rows into columns, which is super useful for summarizing and analyzing data. Imagine you have data that looks like a long list, and you want to break it up into more meaningful chunks—PIVOT helps you do exactly that!
For example, if you have sales data for different years, you can use PIVOT to make each year a column, making the data easier to read and compare.
Syntax for PIVOT:
SELECT <column_list>
FROM
(   SELECT <columns>
   FROM <table_name> )
PIVOT
(   <aggregate_function>(<value_column>)
   FOR <pivot_column> IN (<pivot_values>) ) AS pivot_table;
Table of Contents
Example 1: PIVOT Employee Data by Job Roles
Let’s look at a simple example using an employee table. Say you want to see how many employees each department has, broken down by job roles.
Employee Table (emp):
| emp_id | emp_name | dept_id | job_role |
|---|---|---|---|
| 1 | Alice | 10 | Developer |
| 2 | Bob | 20 | Tester |
| 3 | Charlie | 10 | Developer |
| 4 | Dave | 30 | Manager |
Using PIVOT, we can reorganize the data to show the number of employees in each department by job role.
SELECT dept_id, Developer, Tester, Manager
FROM
(   SELECT dept_id, job_role
   FROM emp
) AS SourceTable
PIVOT
(   COUNT(job_role) FOR job_role IN ('Developer', 'Tester', 'Manager') ) AS PivotTable;
Result:
| dept_id | Developer | Tester | Manager |
|---|---|---|---|
| 10 | 2 | 0 | 0 |
| 20 | 0 | 1 | 0 |
| 30 | 0 | 0 | 1 |
Example 2: PIVOTing Sales Data by Year
Now, let’s take another example using sales data. Suppose you have a table with sales records for different products, and you want to compare sales across years.
Sales Table:
| product_id | product_name | year | sales |
|---|---|---|---|
| 1 | Laptop | 2021 | 5000 |
| 1 | Laptop | 2022 | 7000 |
| 2 | Phone | 2021 | 3000 |
| 2 | Phone | 2022 | 4000 |
We can use PIVOT to turn the year column into separate columns, showing the sales for each year.
SELECT product_name, 2021, 2022
FROM
(   SELECT product_name, year, sales
   FROM sales ) AS SourceTable
PIVOT
(   SUM(sales) FOR year IN (2021, 2022) ) AS PivotTable;
Result:
| product_name | 2021 | 2022 |
|---|---|---|
| Laptop | 5000 | 7000 |
| Phone | 3000 | 4000 |
When Should You Use PIVOT in SQL?
For Reports: If you need to create structured reports from raw data.
To Compare Data: When you want to compare data over time or across categories.

Summarize Information: If you’re looking to summarize data to make it easier to read and analyze.
Quick Tips for Using PIVOT in SQL
Use the Right Aggregation: Functions like SUM(), COUNT(), or AVG() can be used depending on the data.
Clean Your Data First: Be sure that the data is clean before using PIVOT, as null values or inconsistent data can lead to incorrect results.
Optimize Performance: When working with large datasets, PIVOT operations can be expensive. Use indexing and ensure your queries are optimized.
PIVOT in PostgreSQL: Introducing crosstab
- Unlike other SQL databases, PostgreSQL doesn’t have a built-in
PIVOTfunction. Instead, PostgreSQL users can rely on the crosstab function, which is part of thetablefuncextension. - The crosstab function allows you to transform rows into columns, similar to what the PIVOT function does in other databases.
Installing the tablefunc Extension
Before using crosstab, you need to install the tablefunc extension. This can be done by running the following command:
CREATE EXTENSION IF NOT EXISTS tablefunc;Once the extension is installed, you’re ready to use crosstab to pivot data in PostgreSQL.
How crosstab in PostgreSQL Works
The crosstab function is used to turn row values into columns, just like a pivot table. It’s particularly useful when you want to compare values across different categories.
For example, you might want to see the number of employees in each department, broken down by their job roles.
Here’s how the basic syntax of crosstab looks:
SELECT *
FROM crosstab(
    'SELECT <row_columns>, <category_column>, <value_column> FROM <table_name>',
    'SELECT DISTINCT <category_column> FROM <table_name>'
) AS <result_table>(<column_definitions>);
Example : Employee Data Pivot Using crosstab
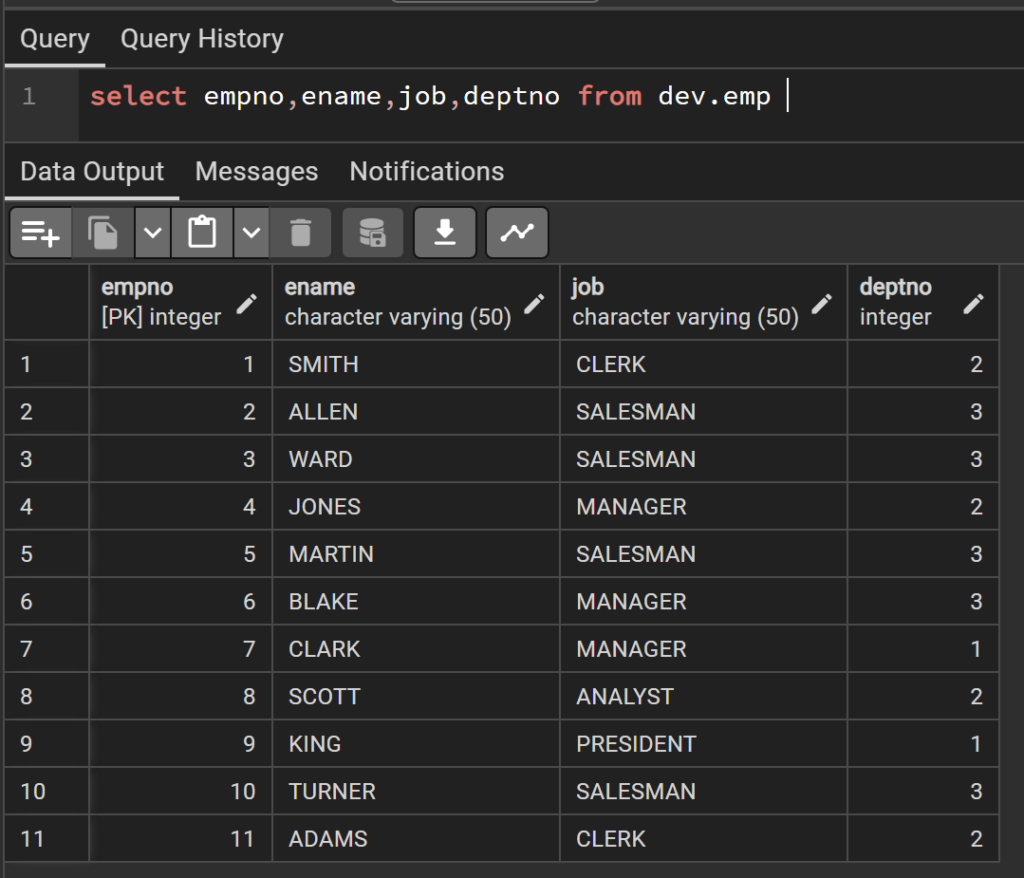
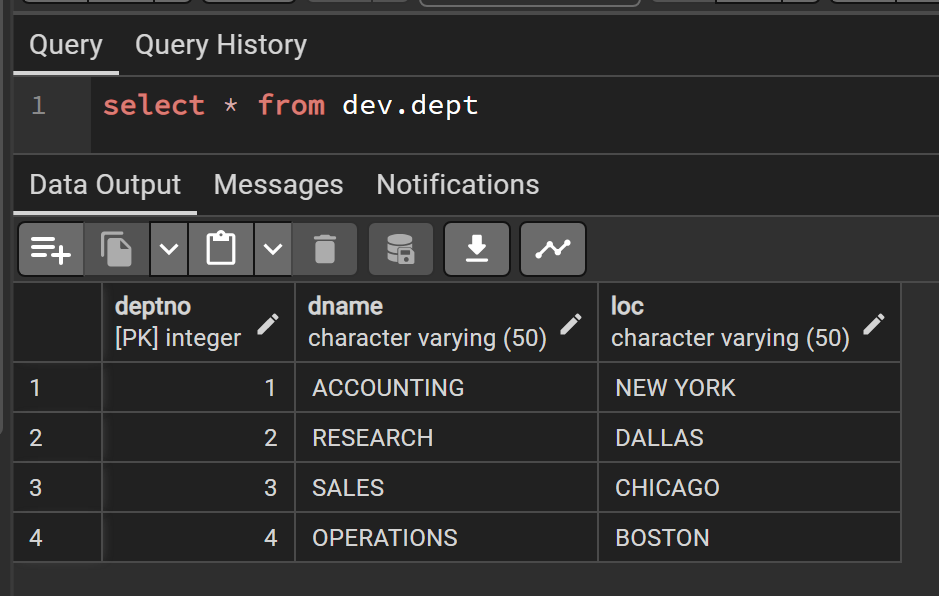
Let’s say you have two tables: emp (employees) and dept (departments), and you want to see how many employees each department has, categorized by their job role.
Employee Table (emp):
Department table (dept) :
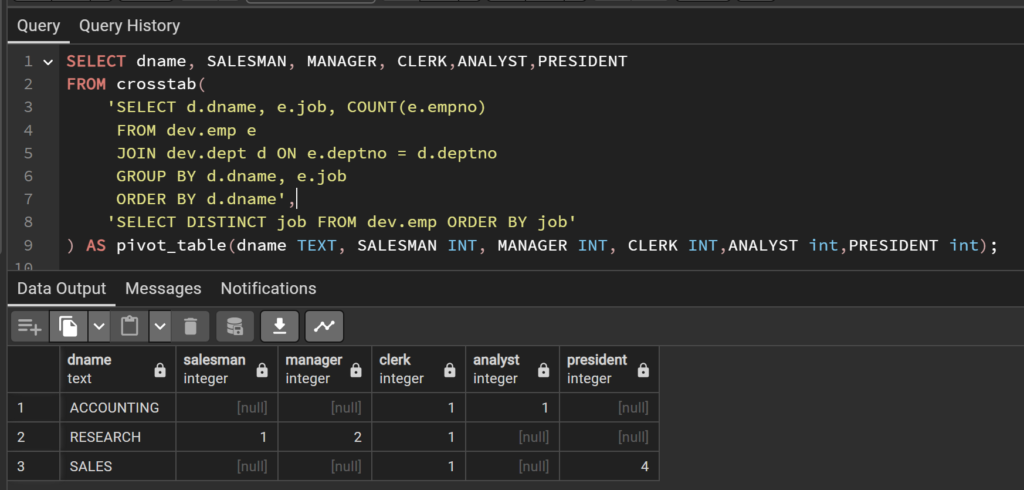
You want to display the number of employees for each job role, categorized by department. Here’s how you can use crosstab for this in PostgreSQL.
Query :
SELECT dname, SALESMAN, MANAGER, CLERK,ANALYST,PRESIDENT
FROM crosstab(
    'SELECT d.dname, e.job, COUNT(e.empno)
     FROM dev.emp e
     JOIN dev.dept d ON e.deptno = d.deptno
     GROUP BY d.dname, e.job
     ORDER BY d.dname',
    'SELECT DISTINCT job FROM dev.emp ORDER BY job'
) AS pivot_table(dname TEXT, SALESMAN INT, MANAGER INT, CLERK INT,ANALYST int,PRESIDENT int);
Result :
How the crosstab in Postgresql Query Works:
- The first parameter in
crosstabis a query that provides the row labels (dname), the column categories (job), and the values you want to aggregate (COUNT(empno)). - The second parameter defines the list of unique categories (job roles) that will become columns.
- Finally, you define the structure of your pivot table (in this case,dname,SALESMAN, MANAGER, CLERK,ANALYST,PRESIDENT).
Key Points to Remember:
- Install
tablefuncExtension: You need to enable thetablefuncextension to usecrosstabin PostgreSQL.
CREATE EXTENSION IF NOT EXISTS tablefunc;- Define Column Categories: Make sure your query has distinct values to pivot into columns.
- Order Matters: Pay attention to ordering in both the queries to ensure the pivoted data aligns correctly.
Conclusion:
The PIVOT function in SQL and Crosstab in PostgreSQL are excellent tools for transforming your data, making it easier to create reports and compare results. With the examples provided, you should now have a solid understanding of how to use PIVOT in SQL and cross tab to restructure your data. Whether you’re summarizing employee data or tracking sales performance, PIVOT makes it easy to get the answers you need.
Latest Posts :
- Mastering PostgreSQL Architecture: 6 Powerful Steps to Optimize Performance & Scalability
- Understanding Oracle Triggers – A Comprehensive Guide with Examples
- SQL Query Design Patterns: Writing Efficient Queries
- Master Oracle Interview Questions: Key Concepts & Examples for 2024
- Ace Your PL/SQL Interview Questions for Success! Part-4
categories :
- Interview Questions (11)
- PLSQL (5)
- PostgreSQL (1)
- SQL (10)